
Sitecore Experience Analytics | Sitecore Certified Implementation and Solution Partner
Sitecore Experience Analytics provides overview reports and detailed reports for marketers and marketing analysts to identify patterns and trends in experience data collected from their websites and potentially other external data sources. This enables you to make more informed decisions on how to allocate your marketing budget. Here’s how to get started with more successful content by concentrating on Engagement Value.
Experience Analytics includes the following report types:
Dashboard – presents a set of charts and success metrics that provide a summary of key analytics.
Audience – assists you in determining who your guests are.
Acquisition – displays the sources of traffic to your website. Campaigns and other marketing platforms, for example.
Behavior – enables you to evaluate your visitors’ behavior in order to better understand how they communicate with your material.
Conversions – The percentage of visitors who complete a given mission. This allows you to determine the efficacy of your marketing activities.
The Dashboard Tab:
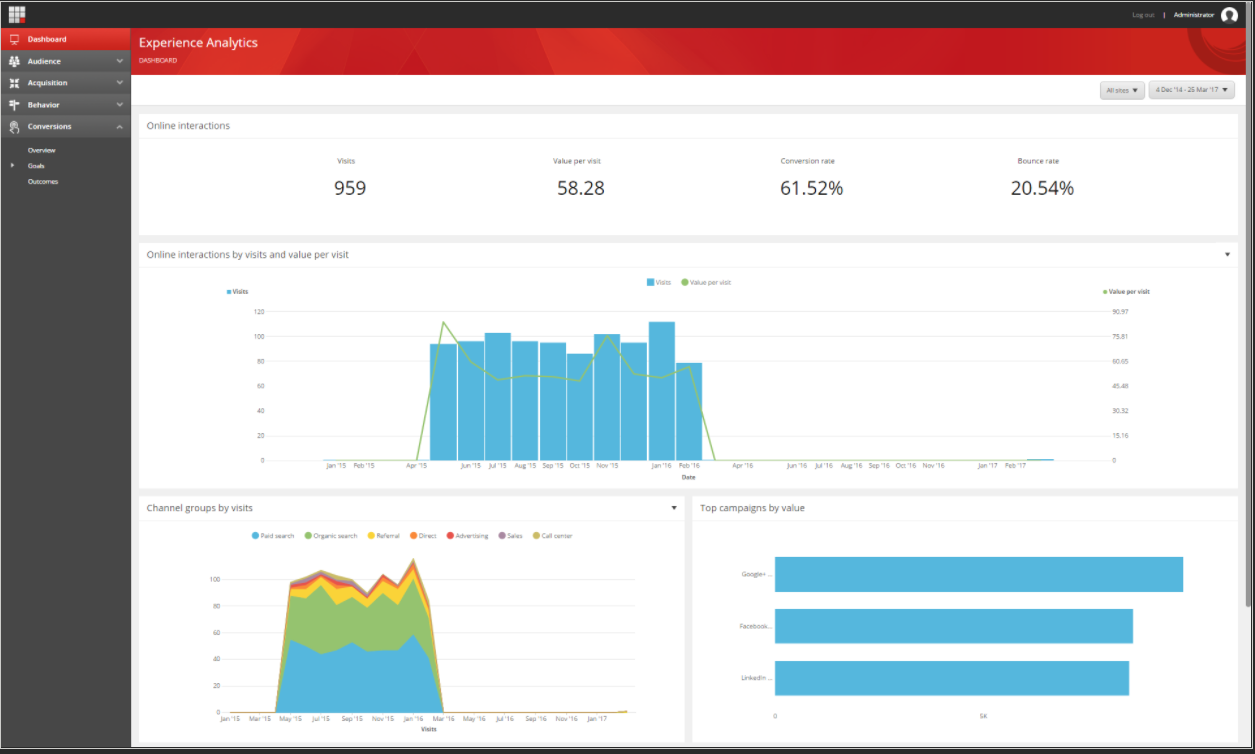
The Experience Analytics Dashboard offers a summary of the top five charts and graphs that provide useful information about communication activities on your website. In short, identifying general marketing patterns on your website is beneficial. These charts and graphs can be found in other categories of xAnalytics.
The Audience Tab:
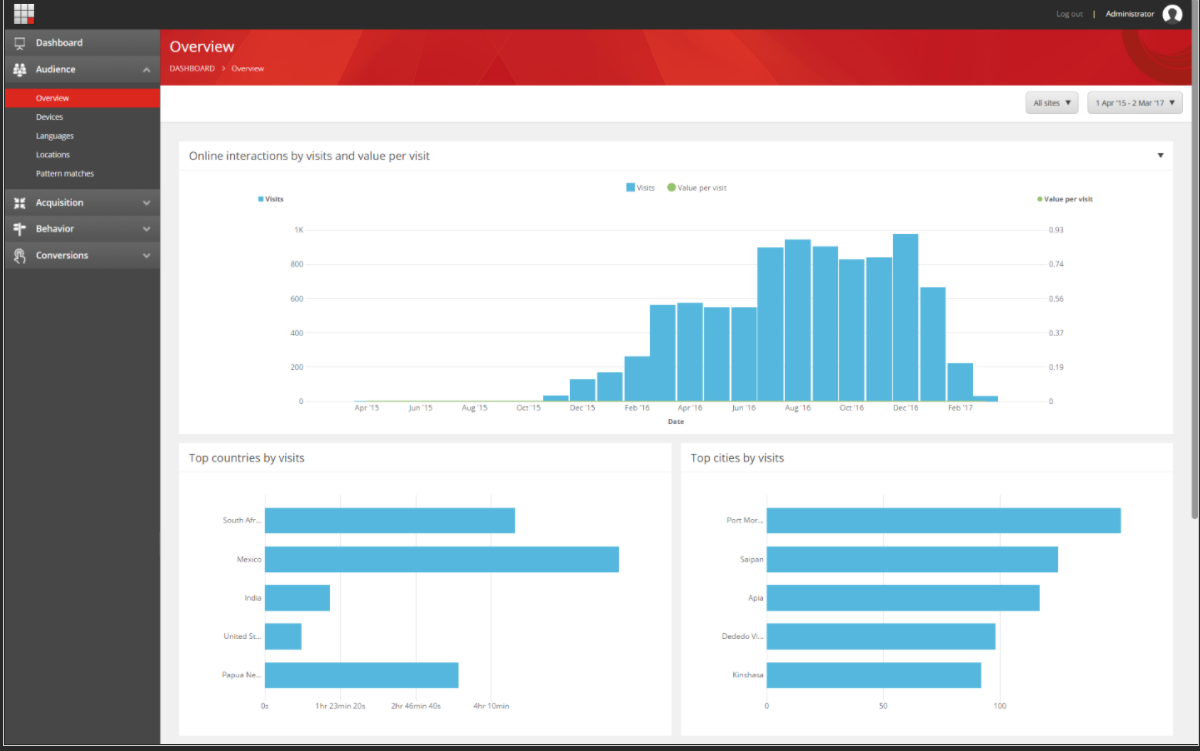
The Audience tab assists you in comprehending the essence of your website users. The Pattern Matches report can be found under this tab, and it informs you about the most common pattern matches as well as the ones that provide the highest value per visit. In addition, you can find analytics information about the devices used to navigate the website, as well as languages and locations.
This tab also contains a full report with details about the number of visits, average length, bounce rate, conversion rate, and page views of every visit for each pattern card.
The Acquisition Tab:
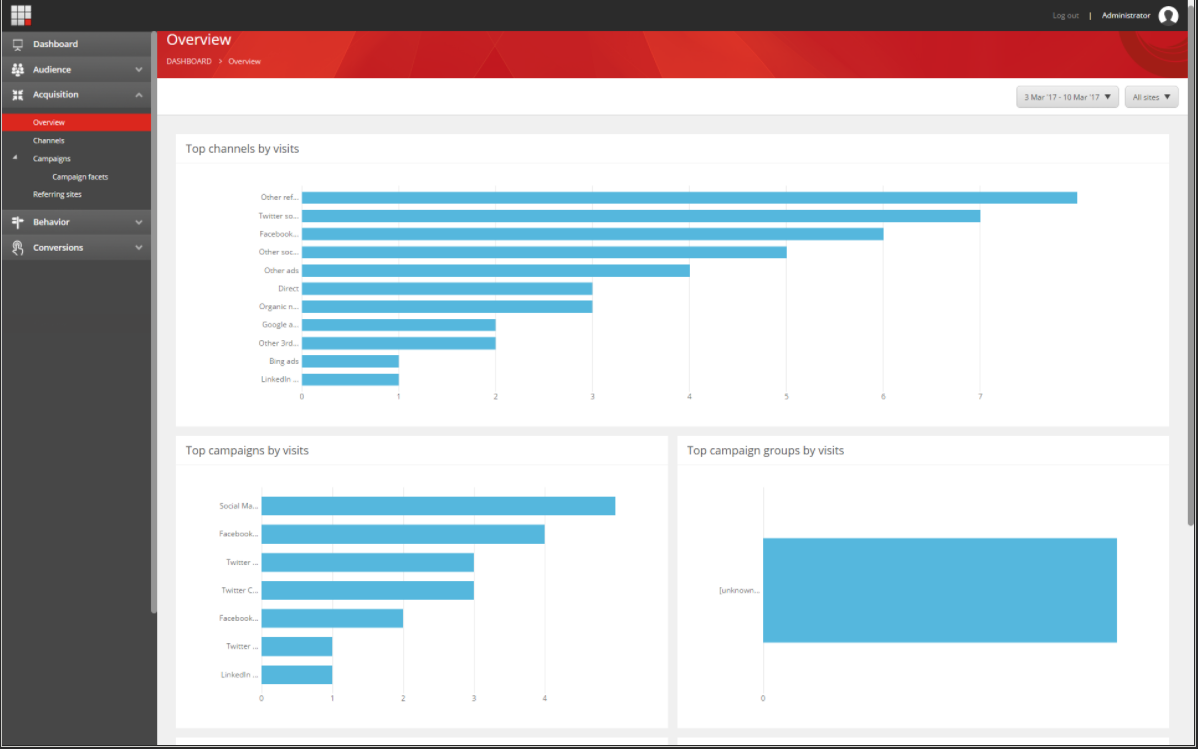
In the Acquisition tab, you can view analytics data that defines what drives online traffic to your website. For example, you’ll be able to see which channels are taking visitors to your site and how effective your marketing campaigns are.
The Behavior Tab:
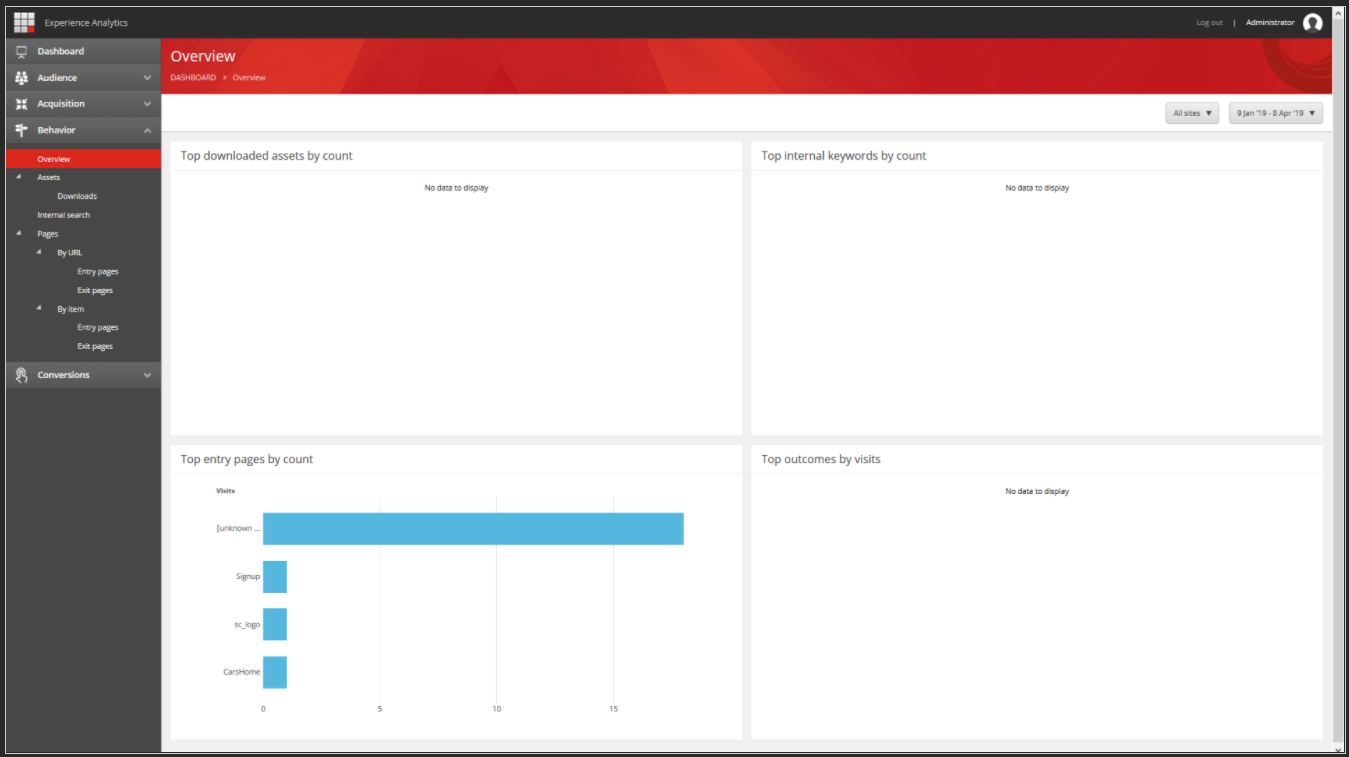
The Behavior tab provides you with additional details about your website visitors’ behavior, as well as which ones produce the most value.
The Conversions Tab:
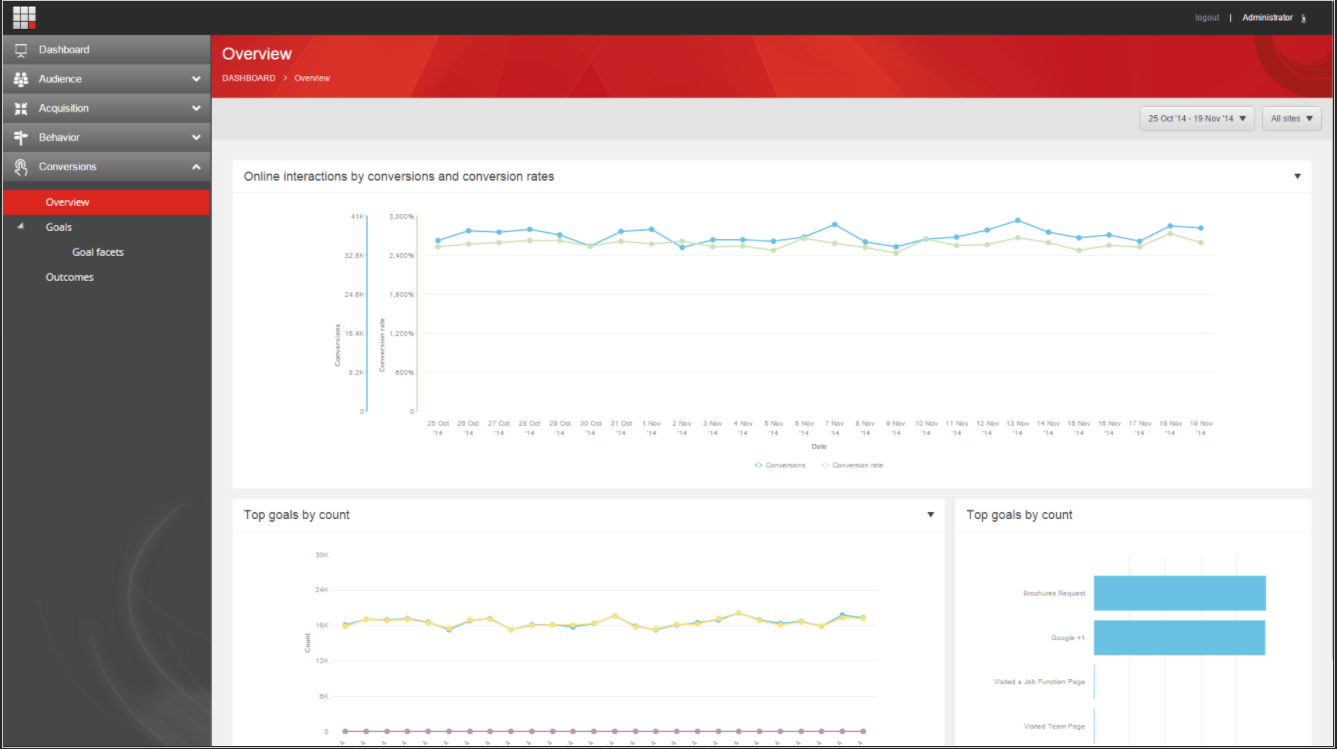
Conversions Overviews include details on online experiences based on conversions and conversion rates. You will also discover the conversion goals as well as a list of all your conversions.
We are the USA and India’s best Sitecore development services and Sitecore technology consulting company. We offer full Sitecore cms development and Sitecore end-to-end implementations with dedicated Sitecore certified developers.
Sitecore Experience Analytics | Sitecore Certified Implementation and Solution Partner
Author: Avinash Veluchamy, Sitecore Specialist